

Proxy Traffic Analytics & Access Logs by Port, IP and Domain
XProxy shows the traffic of every mobile proxy port: which websites and client IPs use it, the success rate, and how much data goes up and down. Open Proxy Analytics for totals, Access Logging for every request, or Port Analytics for one proxy.
You need: the Basic plan or higher (Pricing lists data usage, analytics and real-time traffic logs from Basic) and access logging turned on. It is on by default.
In short
The big picture over 1 hour to 30 days: traffic, requests, unique IPs, success rate, IP rotations and errors.
A live list of every connection. Filter it by port, username, client IP, website or status, and download it as a ZIP.
The same numbers for one modem only: its websites, its clients and its live log. Open it from the row menu in Proxy Management.
Which one do I open?
| You want to know | Open |
|---|---|
| How much data did my proxies use this week? | Proxy Analytics, range 7D, card Total Traffic |
| Which proxy port is the busiest? | Proxy Analytics → Port Breakdown |
| Which websites does my proxy visit? | Proxy Analytics → Domain/IP Breakdown, or Port Analytics → Websites & Hosts |
| Who is connecting to my proxy? | Proxy Analytics → IP Breakdown or User Breakdown, or Port Analytics → Clients |
| Why do some requests fail? | Access Logging, filter Status Code to ALL ERRORS |
| Is somebody trying to guess my proxy password? | Access Logging, card Unauthorized |
How do I see traffic per port, client IP and website?
Follow the guide. It starts with the logging switch and ends with the live log of one port.
Step 1 of 5
Analytics is built from the access log, so the log must be on. It is on by default. To check, open Proxy Management → Proxy Settings → General and find Proxy Logging Setting.
- Turn on Enable 1 under Proxy Access Logs.
- Set Max Storage Days 2, from 1 to 30 days. The log files grow with your traffic, so do not set it higher than you need.
What else is on the Proxy Analytics page?
Below the breakdown tables the page has three more blocks:
- IP Rotation: total rotations, average rotation time, duplicate IPs and failed rotations, with a table of the IPs each position used. See IP pools, rotation log & uptime statistics for the per-modem history, and how to rotate the IP.
- Uptime by Position: which modem slots were online the least.
- Error Breakdown: which error types happen and how often.
How do I search and download the proxy access log?
Open Access Logging in the left menu, under Monitor. The list is live: new requests appear at the top as they happen.
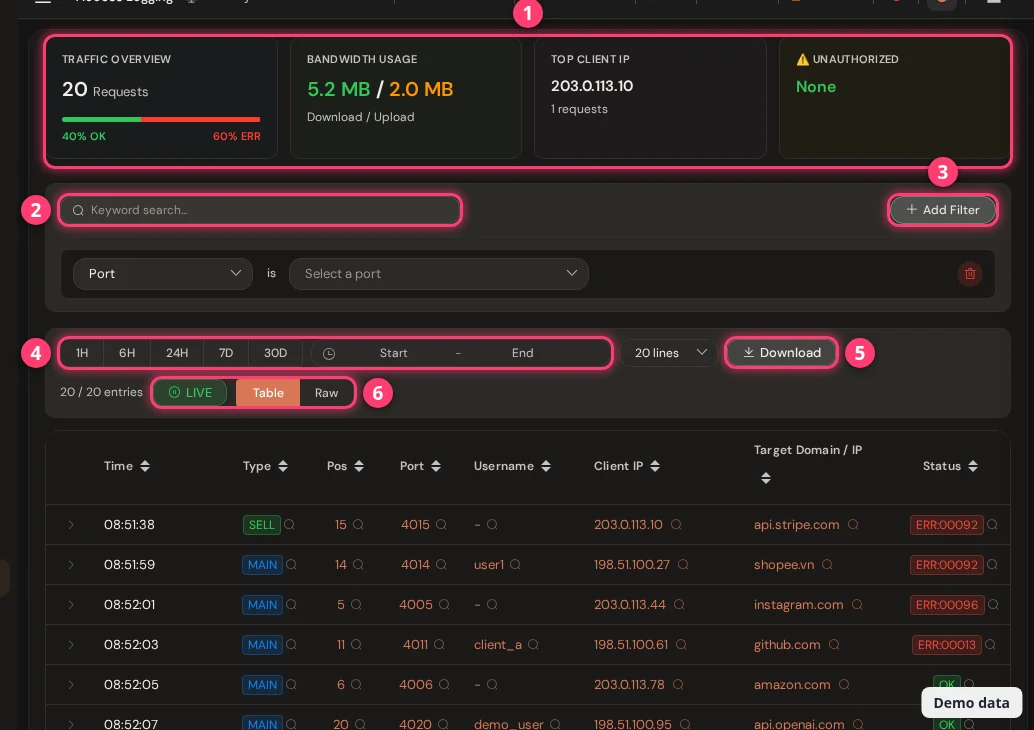
- Summary cards. They count the lines now on screen: requests with the share of OK and errors, download and upload, the top client IP, and Unauthorized, the IPs that failed to log in. Click the View List button there to see them and filter by one.
- Search and filters. Type a keyword, or click Add Filter and pick a field: Port, Position, Username, Client IP, Target Host, Method, Status Code or Log Type. You can also click the small magnifier next to any value in the table to filter by it.
- Time range. 1H to 30D, or your own start and end. Looking at the past pauses the live list. Press LIVE to go back.
- Table or Raw. The table can be expanded per row to show the raw log line. Raw shows plain text.
- Download. A ZIP file. With no filter you get all the log files on the box. With a filter, a keyword or a time range you get one text file with the matching lines (up to 100,000).
Want the logs outside the panel, for dashboards and alerts? Stream them to your own server: Realtime telemetry log streaming.
What do MAIN, SELL and GROUP mean?
Every log line carries the kind of port it came from.
| Type | Port |
|---|---|
| MAIN | The normal proxy ports of your modems. |
| SELL | Shared ports of the Selling Platform (Business plan). |
| GROUP | Ports of a Proxy Group. |
What do the status codes in the log mean?
Each line ends with a status. OK is a success. ERR: followed by a number is an error. Hover over a status in the table to read its meaning. The ones you will meet most:
| Status | Meaning | What to do |
|---|---|---|
00001 to 00008 | Access or login refused: denied by a rule, no username, unknown username or wrong password. The Unauthorized card counts these. | Check the username and password in the client, or the IP whitelist. See Proxy settings. |
00010 | Traffic or bandwidth limit exceeded. | Check the traffic or speed limit set for that port. |
00013 | Failed to connect to the target server. | Try again. If it repeats, rotate the IP or run the Speed check. |
00092 | Connection timed out, or taking too long. | Run the Speed check to see where the delay is. |
00095 / 00096 | The client (95) or the target server (96) dropped the connection suddenly. | See which client or website repeats, and check that one. |
00100 | Domain name or host not found. | Check the address. If it is right, check the DNS settings. |
FAQ
Why is Proxy Analytics empty or old?
Either access logging is off (the page shows a warning), or there was no traffic in the range you picked. Analytics reads the log about once a minute, so give new traffic a minute to appear.
How long is the data kept?
The raw log keeps as many days as Max Storage Days says (3 on a fresh box, 1 to 30 allowed). The numbers behind Proxy Analytics are summarised and kept for about 30 days, so a range of 30 days works even when the raw log is shorter.
What do [Internal] and [Startup / Listen] mean?
They are lines the proxy wrote about itself, for example when a port starts. They have no real client IP or website.
How is the success rate worked out?
Requests with status OK, divided by all requests of that port, IP, user or website. It is shown in green from 99%, orange from 90%, and red below that.
What next?
Send the logs to your own dashboard, check the history of each IP, or find out why a proxy is slow.