
Realtime Telemetry Log Streaming
Stream proxy access logs from your XProxy server to Graylog or SigNoz in real time — monitor multiple devices from one place, build dashboards, and alert on errors.
Why use centralized log streaming?
- Unified monitoring — watch access and health across all XProxy nodes in real time.
- Easy querying — filter by device, region, action, or error code.
- Faster troubleshooting — quickly isolate errors, traffic spikes, or abnormal behavior.
Recommended labeling
- Host Identifier — per-server name, e.g.
sg-core-01,us-east-02. - Service Name — group by region or business unit, e.g.
xproxy-region-a.
Every log carries these labels, making it easy to build dashboards and cross-device filters.
Common use cases
- Unique client IP counting — estimate real traffic and spot unfamiliar sources.
- Error rate tracking — filter
error_code != 00000to measure reliability. - Top destinations & bandwidth — group by
destination_host, sumreceived_bytesandsent_bytes. - Per-device/port monitoring — use
modem_position,proxy_port,proxy_serviceto isolate a specific dongle. - Anomaly detection — alert on sudden traffic spikes or elevated error codes.
Operational tips for many devices
- Consistent naming — standardize Host Identifier and Service Name by region or group.
- Environment separation — use prefixes like
prod-/stg-in Service Name. - Retention planning — set index rotation in Graylog; monitor usage/retention in SigNoz Cloud.
- Health alerts — alert when a node stops sending logs for N minutes; re-run Test Connection after adding new nodes.
Option A — Graylog
Install Graylog
Requirements: Ubuntu Server 20.04 or 22.04, minimum 2 GB RAM (4 GB recommended).
curl x-proxy.io/graylog | bash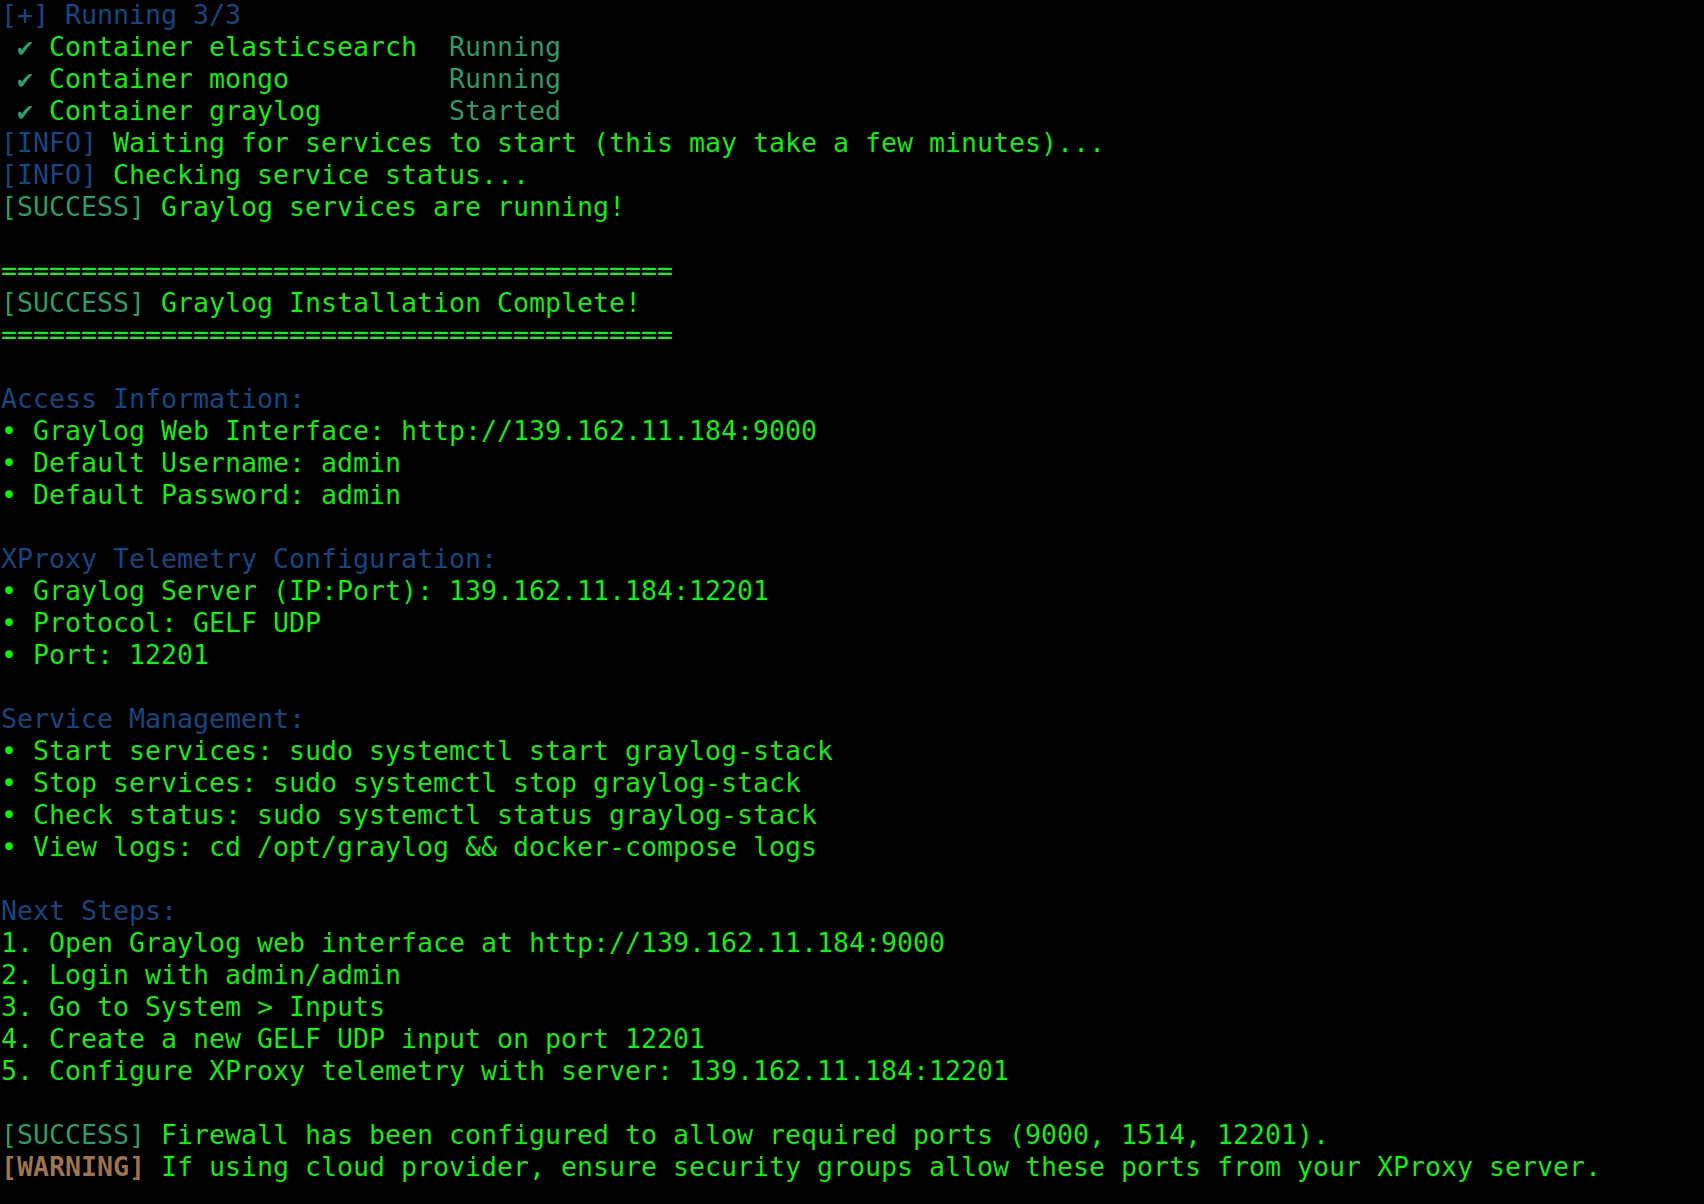
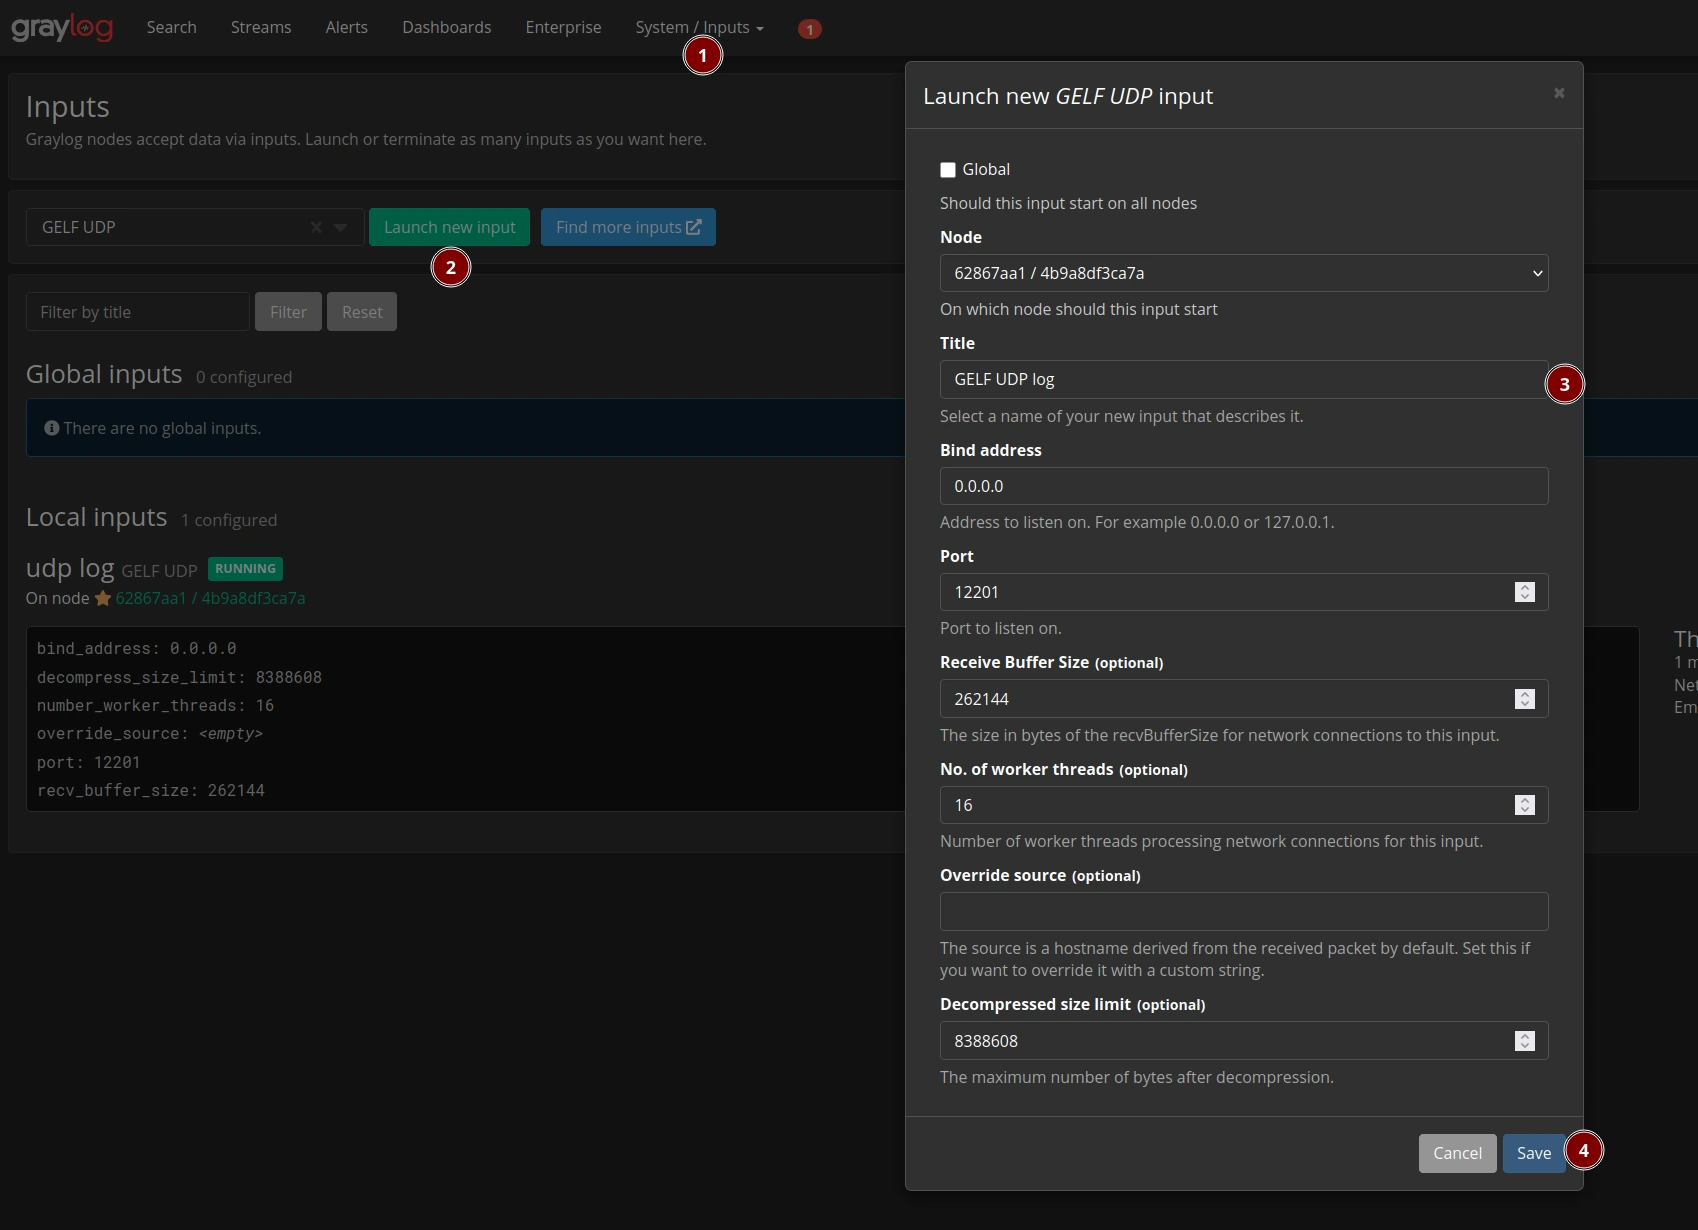
Create a GELF UDP input
- Open Graylog → System → Inputs.
- Choose GELF UDP and click Launch new input.
- Set Bind address to
0.0.0.0and Port to12201. - Click Save.
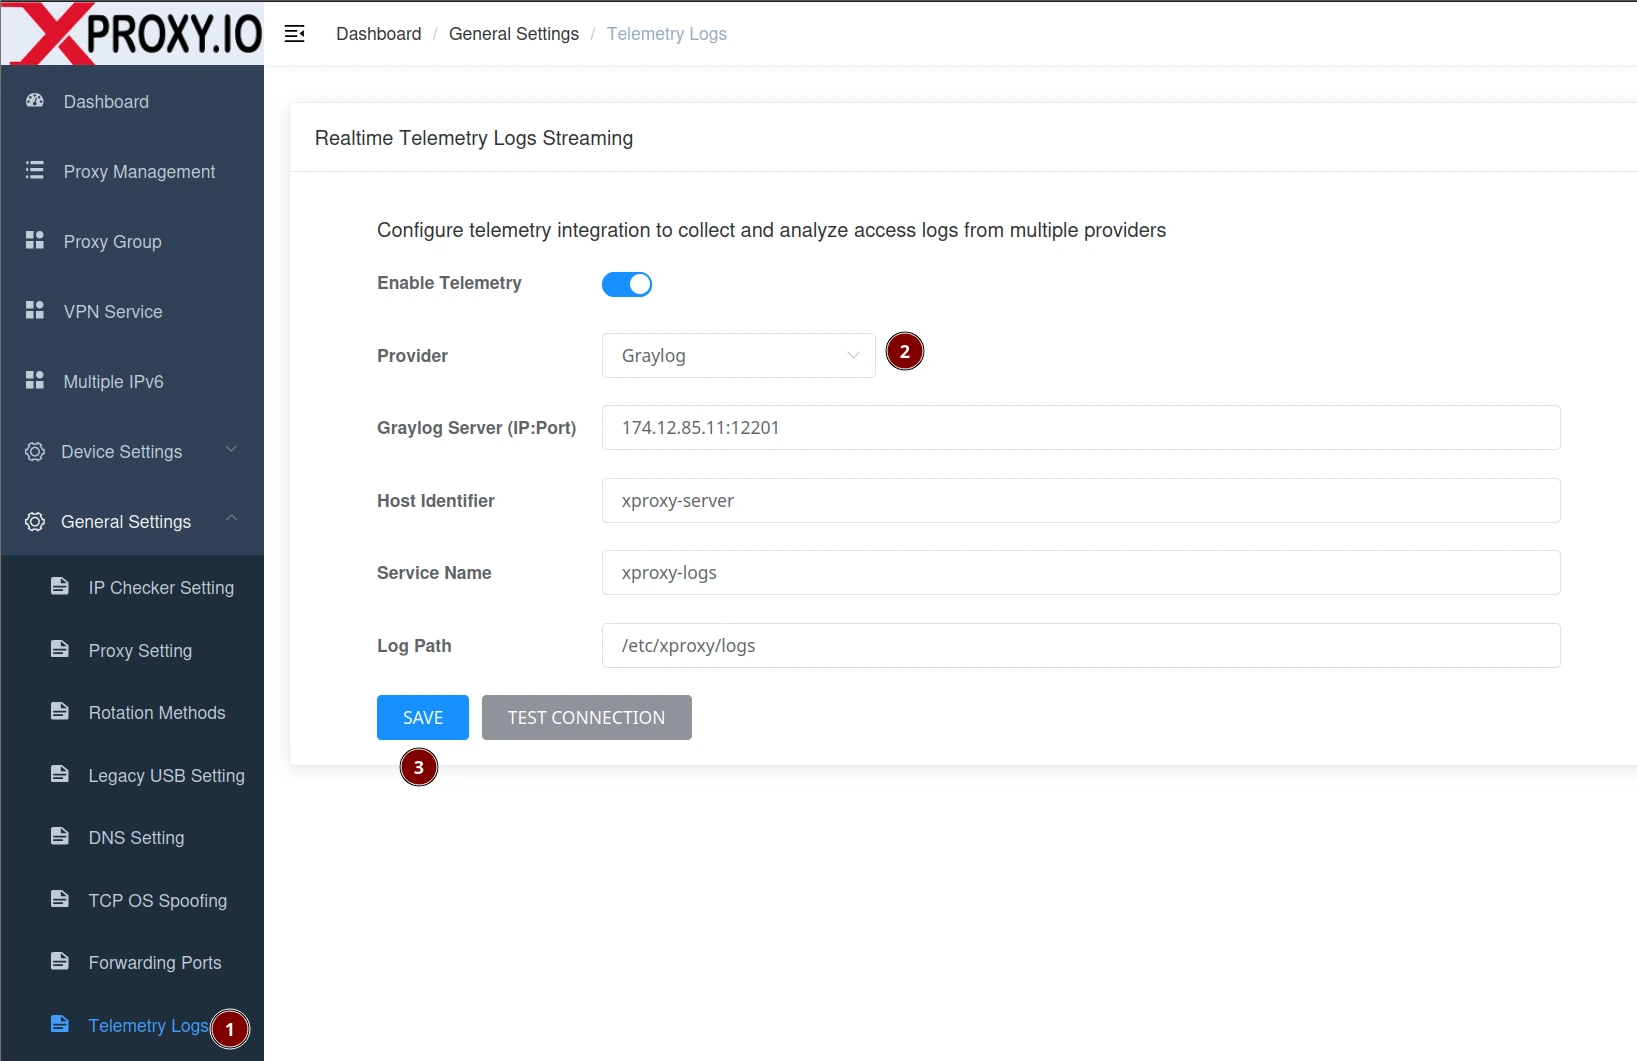
Configure XProxy for Graylog
- Open General Settings → Telemetry Logs.
- Toggle Enable Telemetry ON.
- Set Provider to Graylog.
- Enter Graylog Server as
YOUR_GRAYLOG_IP:12201. - Set Host Identifier and Service Name (optional but recommended).
- Click Save, then Test Connection.
Query examples in Graylog
# By service/cluster
service_name:xproxy-region-a

# Only errors
error_code:!00000

# By action
action:CONNECT

# By device/slot
modem_position:3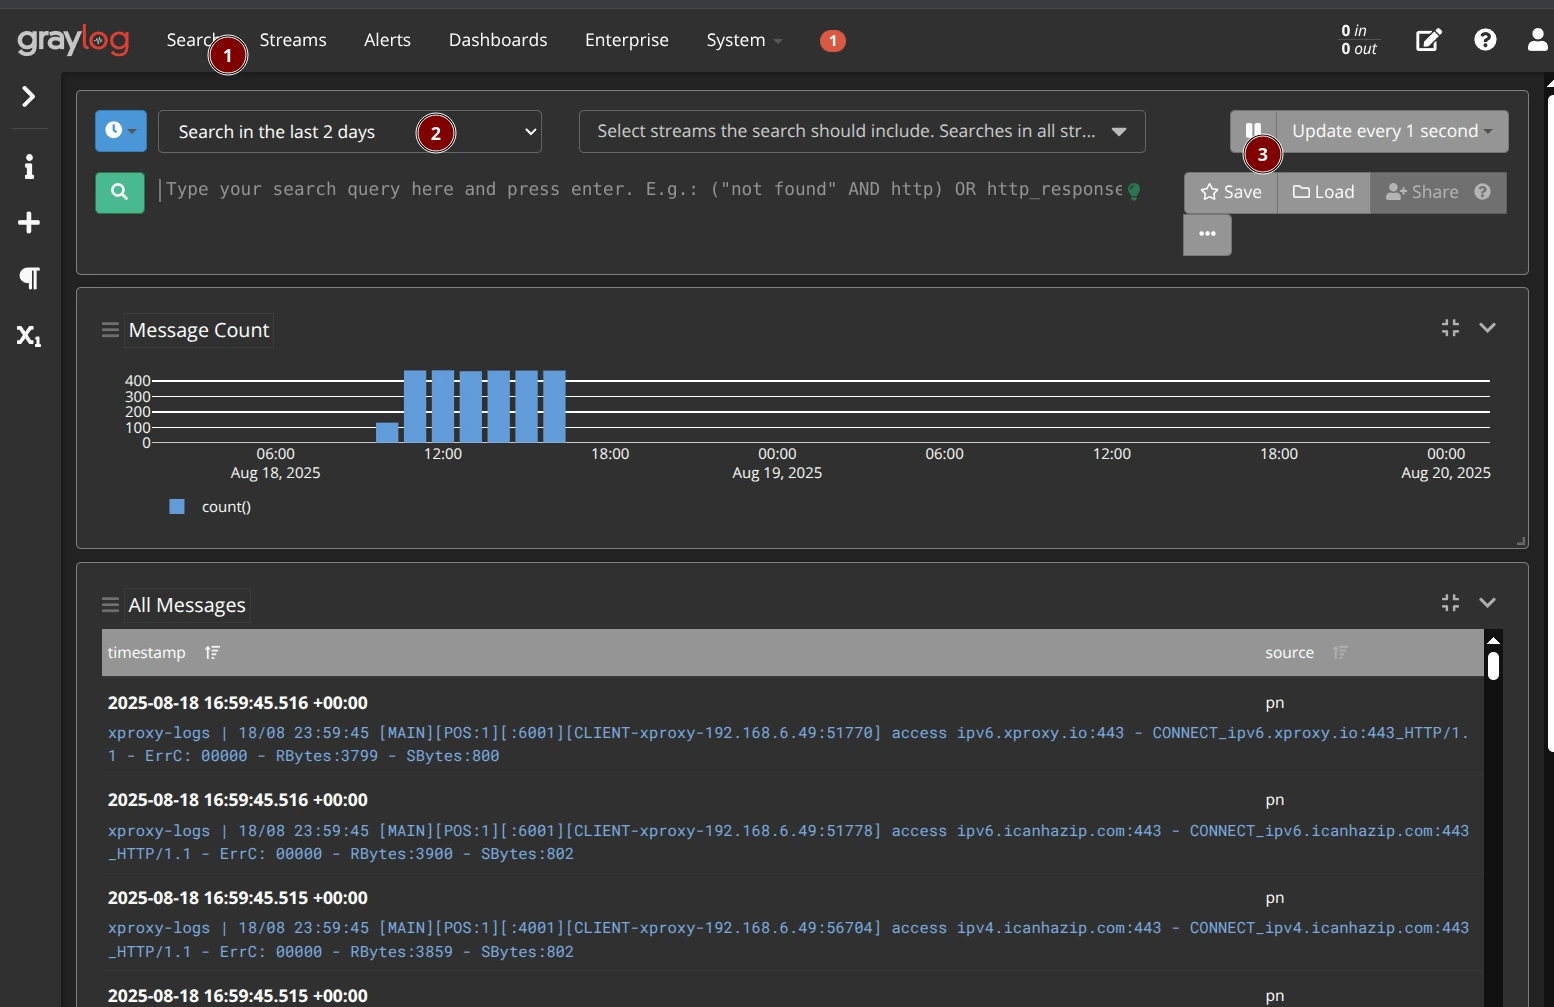
Option B — SigNoz
Install SigNoz (Community)
Requirements: Ubuntu Server 20.04, 22.04, or 24.04. Skip if using SigNoz Cloud.
curl x-proxy.io/signoz | bash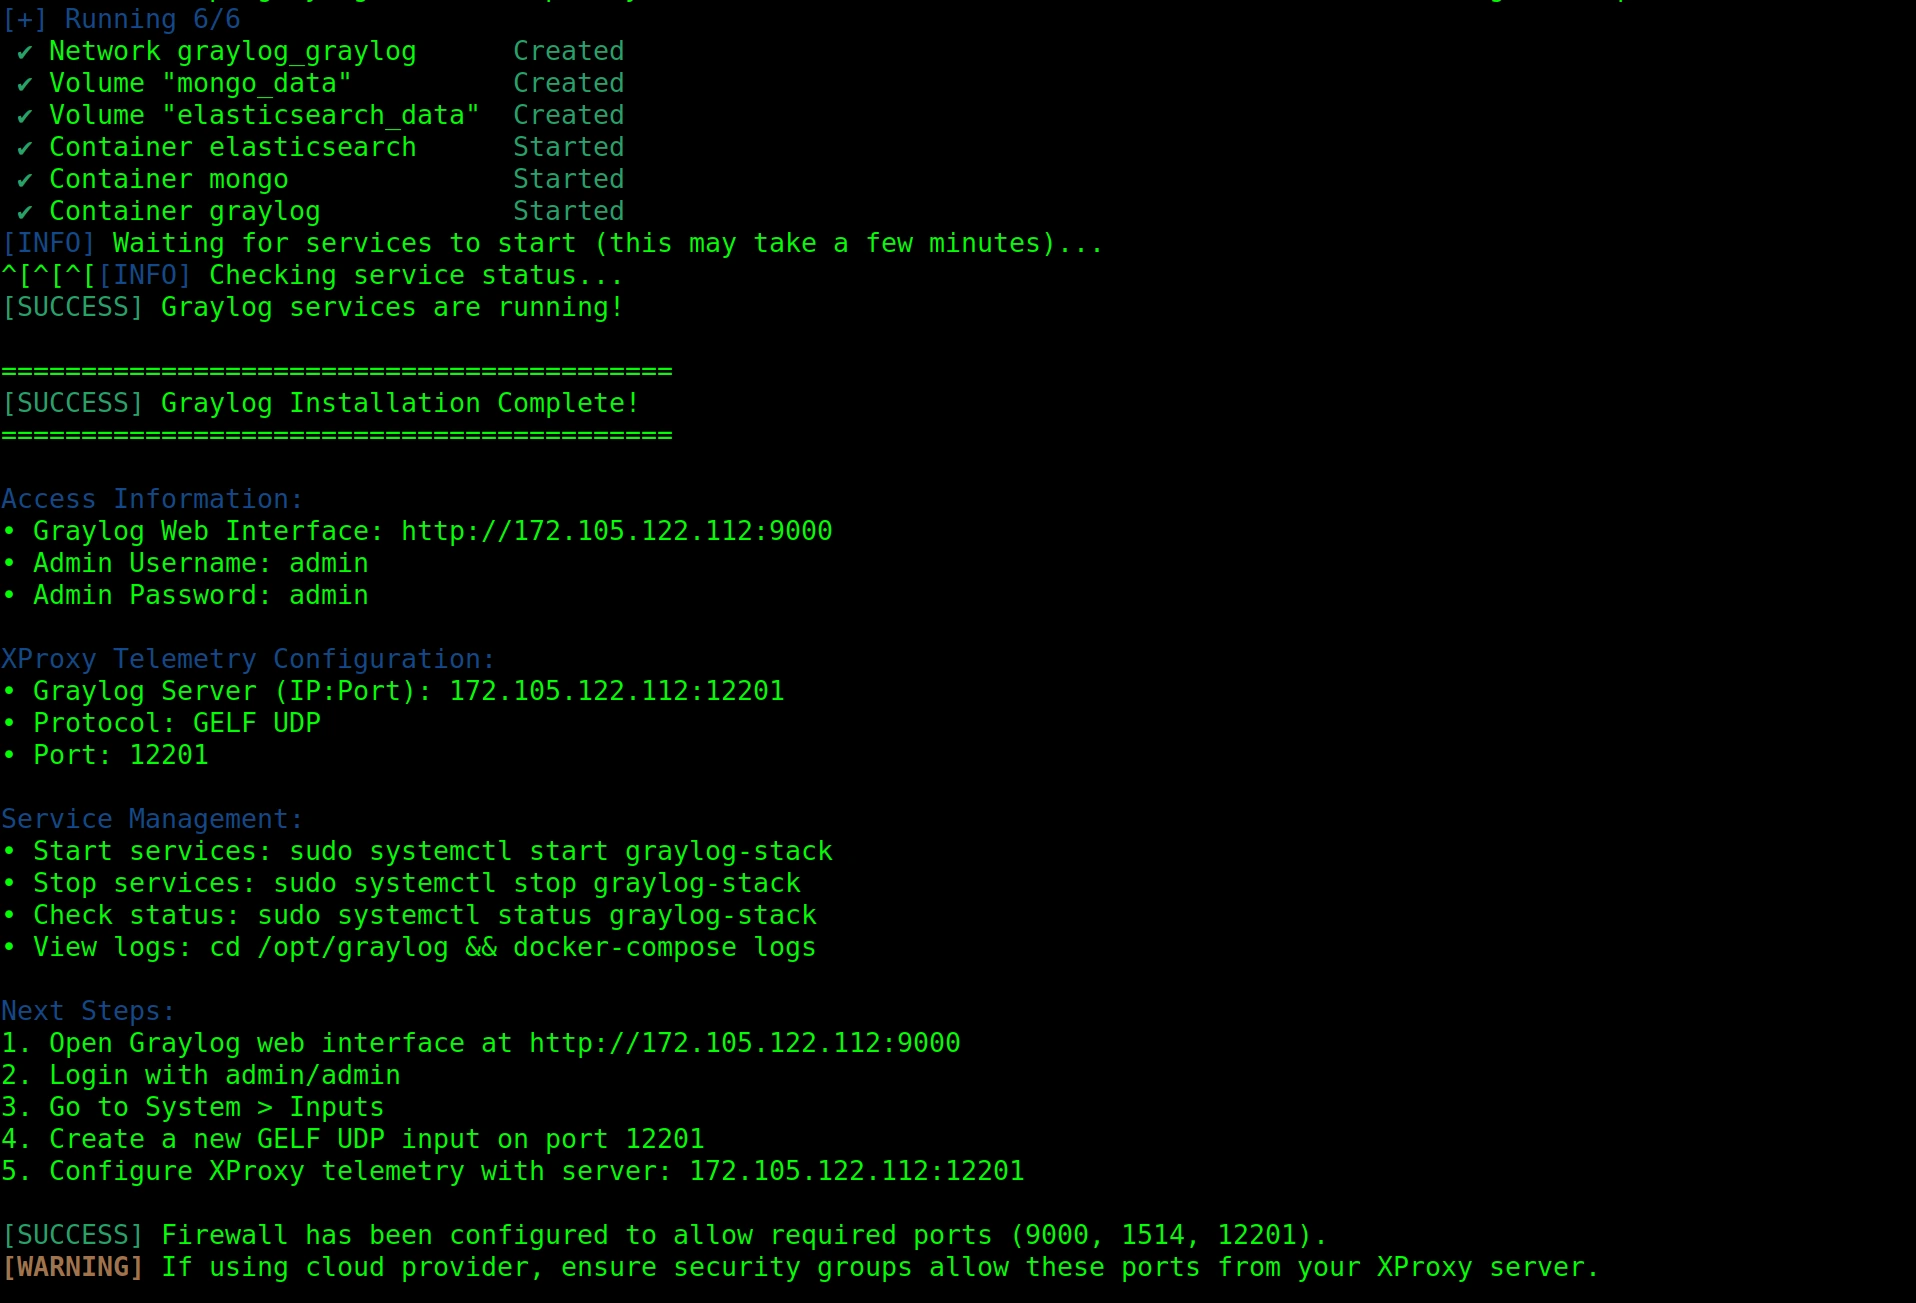
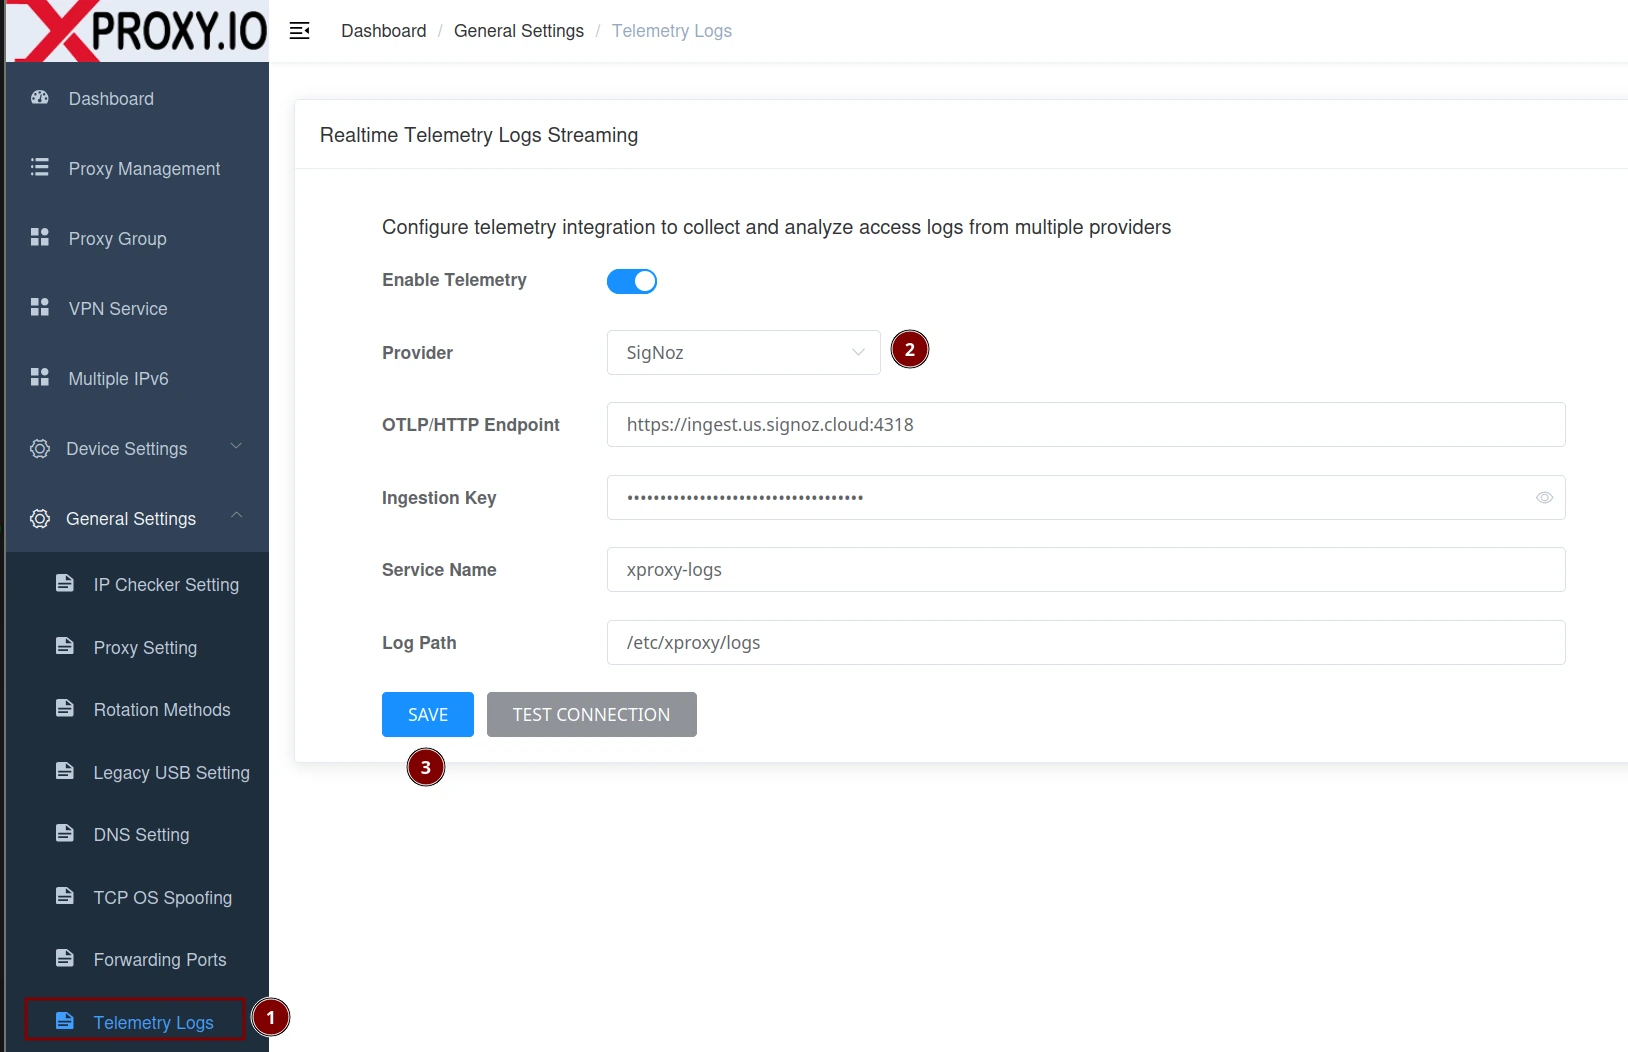
Configure XProxy for SigNoz
- Open General Settings → Telemetry Logs.
- Toggle Enable Telemetry ON and select SigNoz as Provider.
- Enter OTLP/HTTP Endpoint, e.g.
https://ingest.us.signoz.cloud:4318. - Paste your Ingestion Key (SigNoz Cloud) or leave blank for local installs.
- Set Service Name (e.g.
xproxy-region-a). - Click Save, then Test Connection.
Query examples in SigNoz
# By service name
service.name = "xproxy-region-a"

# Only errors
attributes.error_code != "00000"

# By action
attributes.action = "CONNECT"

# By device/slot
attributes.modem_position = 3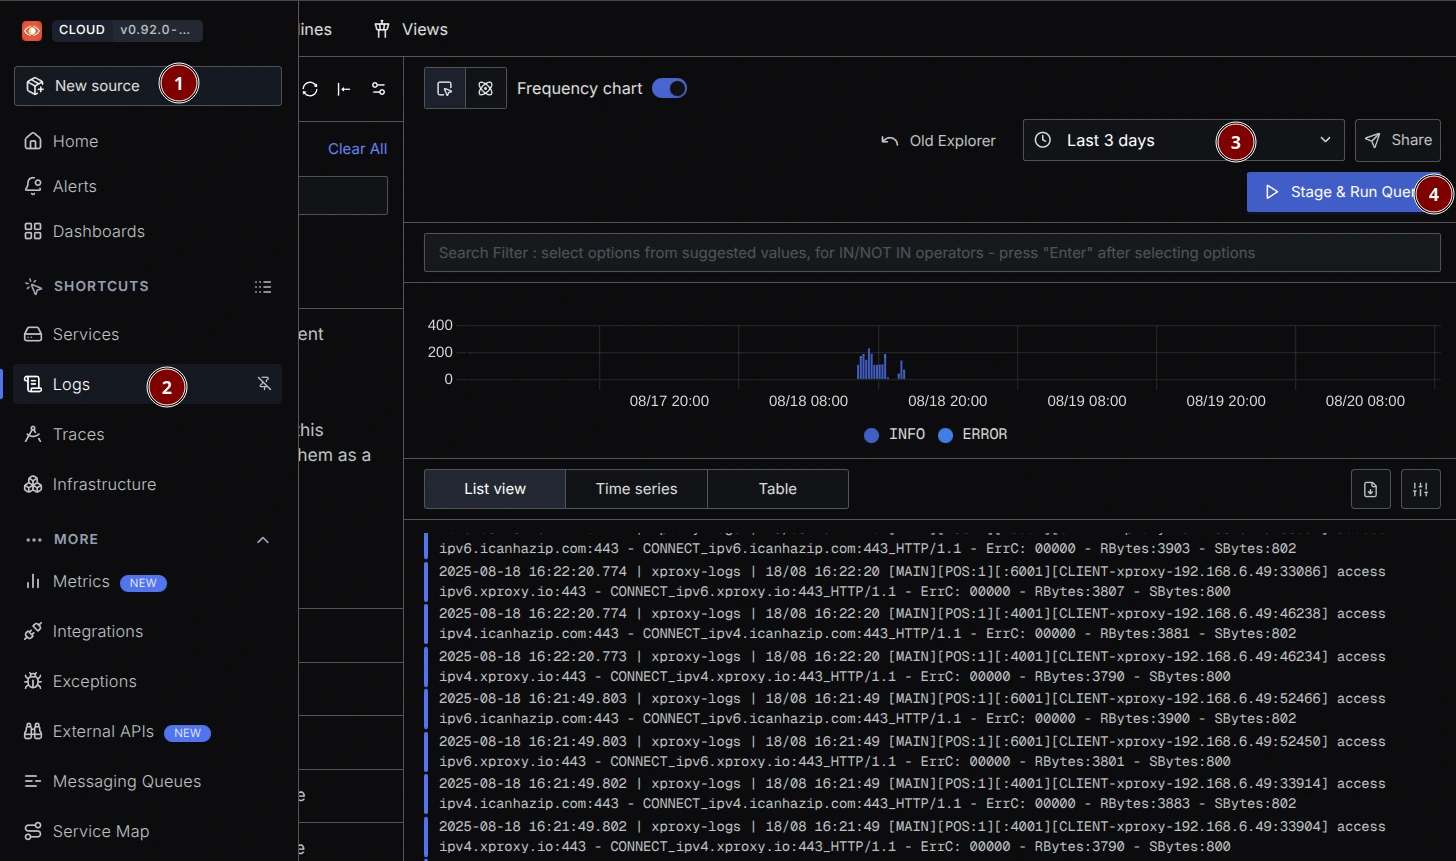
Log field reference
| Field | Description |
|---|---|
log_date | Date of the log (DD/MM) |
log_time | Time of the log (HH:MM:SS) |
proxy_service | Service group name (e.g. MAIN) |
modem_position | Device/slot index serving the request |
proxy_protocol | HTTP or SOCKS5 |
proxy_port | Proxy listening port on XProxy |
proxy_user | Username used to authenticate (empty for IP whitelist) |
client_ip | IP of the client using the proxy |
destination_host | Target host requested via proxy |
destination_port | Target port |
action | CONNECT (tunnel) or ACCESS (HTTP request) |
error_code | 00000 = success; non-zero = error |
received_bytes | Bytes from destination to client |
sent_bytes | Bytes from client to destination |
Error code reference
XProxy emits a five-digit error_code in logs (e.g. 00000, 00004). Leading zeros are intentional for consistent sorting and filtering.
00000— Success (connection closed normally)00001–00009— Authentication errors (ACL/username/password)00010— Traffic limit exceeded00011–00019— Connection errors (socket/bind/connect)00020–00029— Internal errors (e.g. memory allocation)00030–00039— HTTP CONNECT proxy redirection errors00050–00069— SOCKS5 proxy redirection errors00090–00099— Connection timeouts / network issues00100— Host not found00200–00299— UDP portmapper errors00300–00399— TCP portmapper errors00400–00499— SOCKS proxy errors00500–00599— HTTP proxy errors
Troubleshooting
- No data — ensure telemetry is enabled and you clicked Save. Generate traffic via any proxy port.
- Graylog — confirm the GELF UDP input is running on port 12201 and firewall allows UDP 12201.
- SigNoz — endpoint must include port 4318 and be reachable via HTTPS. Verify ingestion key and workspace region.
Verify everything works
- Graylog — search
service_name:xproxy-logsand check message fields on the right panel. - SigNoz — in Logs Explorer, filter by your exact configured service name, e.g.
service.name = "xproxy-region-a". Or clear filters to see all logs and confirm ingestion; open any row to see attributes.
FAQ
How do I verify logs are streaming?
Use the Verify everything works section above: in Graylog search service_name:xproxy-logs; in SigNoz open Logs Explorer and filter by service.name.
How to distinguish devices or regions?
Set Host Identifier per server and Service Name per region or cluster. These labels appear in every log.
Why is proxy_user empty?
You are likely using IP whitelist; the authentication username is not present.
What is the difference between CONNECT and ACCESS?
CONNECT is establishing a tunnel; ACCESS is a proxied HTTP request to a destination.
How can I alert on errors?
Create a rule on error_code != "00000" over a time window; group by service_name or modem_position to pinpoint the source.
