
リアルタイム テレメトリー ログ配信
Stream proxy access logs from your XProxy server to Graylog or SigNoz in real time — monitor multiple devices from one place, build dashboards, and alert on errors.
Why use centralized log streaming?
- Unified monitoring — watch access and health across all XProxy nodes in real time.
- Easy querying — filter by device, region, action, or error code.
- Faster troubleshooting — quickly isolate errors, traffic spikes, or abnormal behavior.
Recommended labeling
- Host Identifier — per-server name, e.g.
sg-core-01,us-east-02. - Service Name — group by region or business unit, e.g.
xproxy-region-a.
Every log carries these labels, making it easy to build dashboards and cross-device filters.
一般的なユースケース
- ユニークなクライアント IP のカウント — 実際のトラフィックを推定し、見慣れない送信元を検出します。
- エラー率の追跡 —
error_code != 00000でフィルタリングして信頼性を測定します。 - 上位の宛先と帯域幅 —
destination_hostでグループ化し、received_bytesとsent_bytesを合計します。 - デバイス/ポートごとの監視 —
modem_position、proxy_port、proxy_serviceを使用して特定のドングルを特定します。 - 異常検知 — トラフィックの急増やエラーコードの増加に対してアラートを設定します。
多数のデバイスを運用するためのヒント
- 一貫した命名 — 地域やグループごとに Host Identifier と Service Name を標準化します。
- 環境の分離 — Service Name に
prod-/stg-などのプレフィックスを使用します。 - 保持期間の計画 — Graylog でインデックスローテーションを設定し、SigNoz Cloud で使用量/保持期間を監視します。
- ヘルスアラート — ノードが N 分間ログを送信しなくなったらアラートを出し、新しいノード追加後は Test Connection を再実行します。
Option A — Graylog
Install Graylog
必要な環境・要件: Ubuntu Server 20.04 or 22.04, minimum 2 GB RAM (4 GB recommended).
curl x-proxy.io/graylog | bash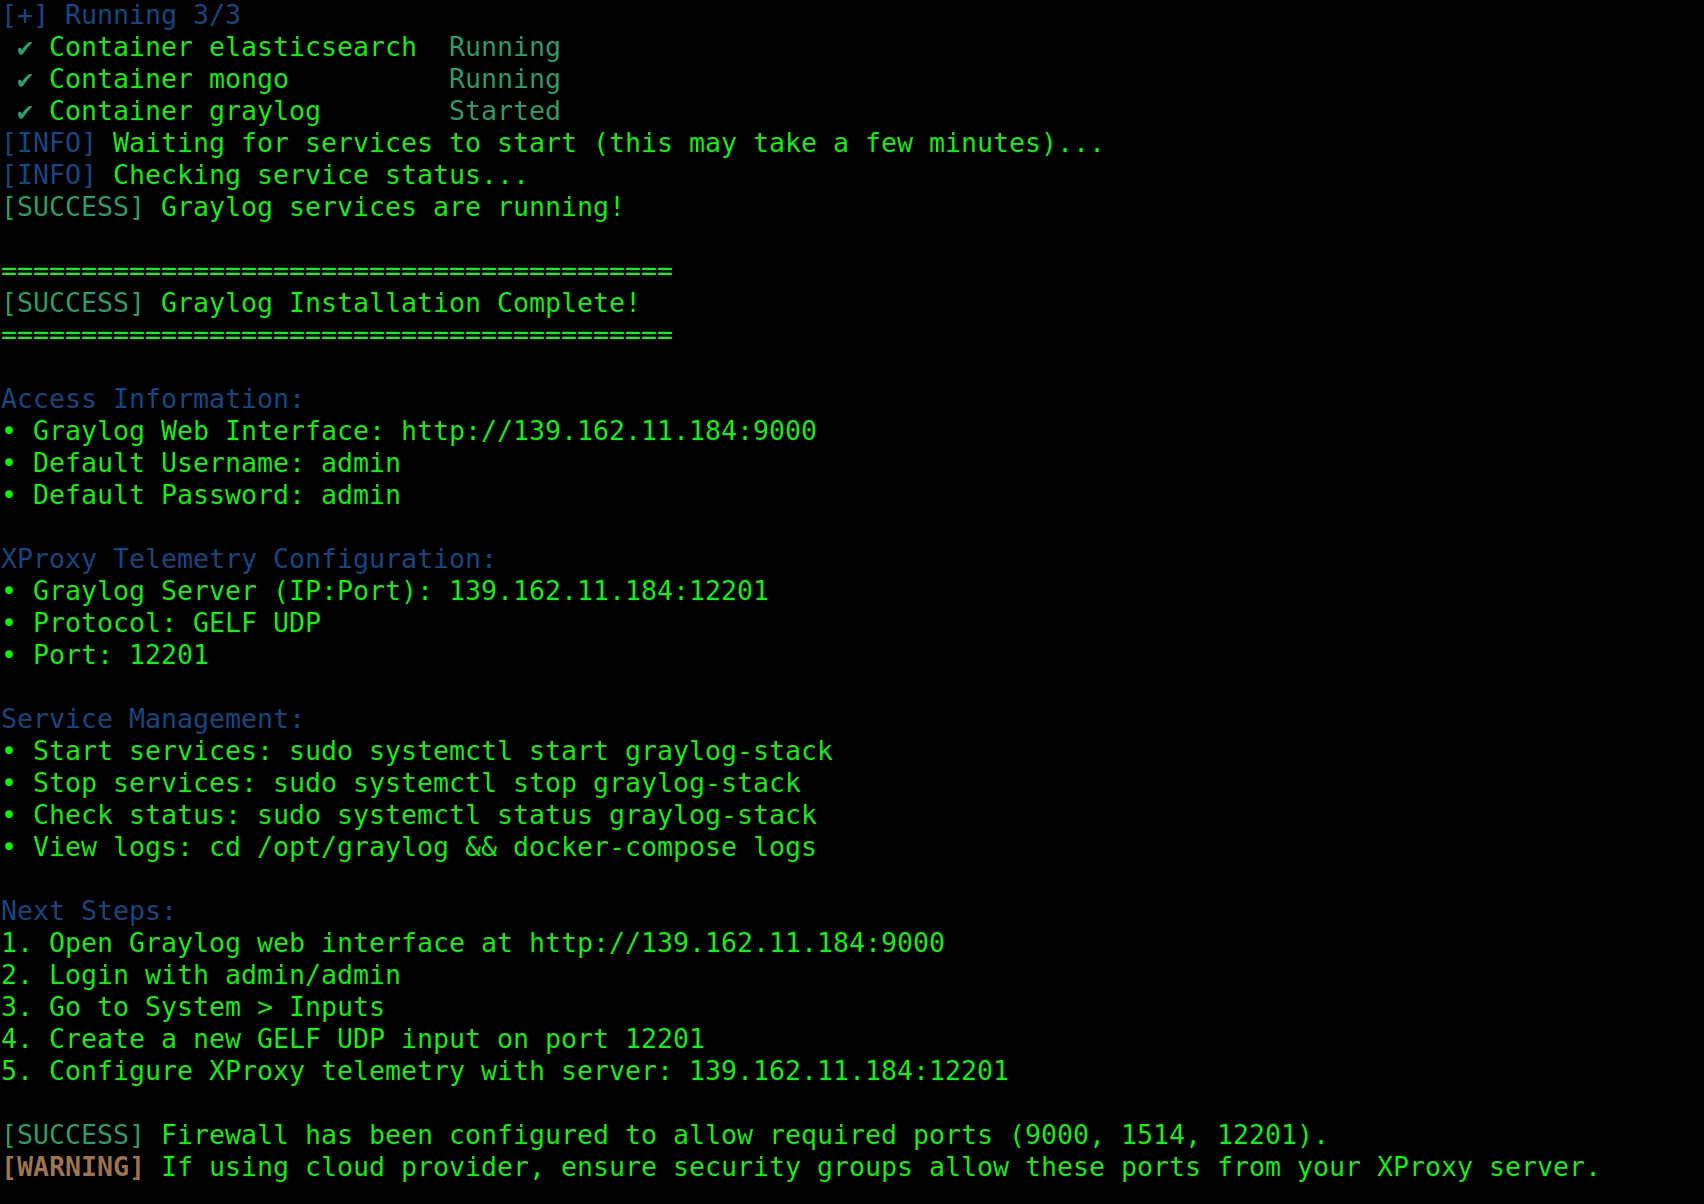
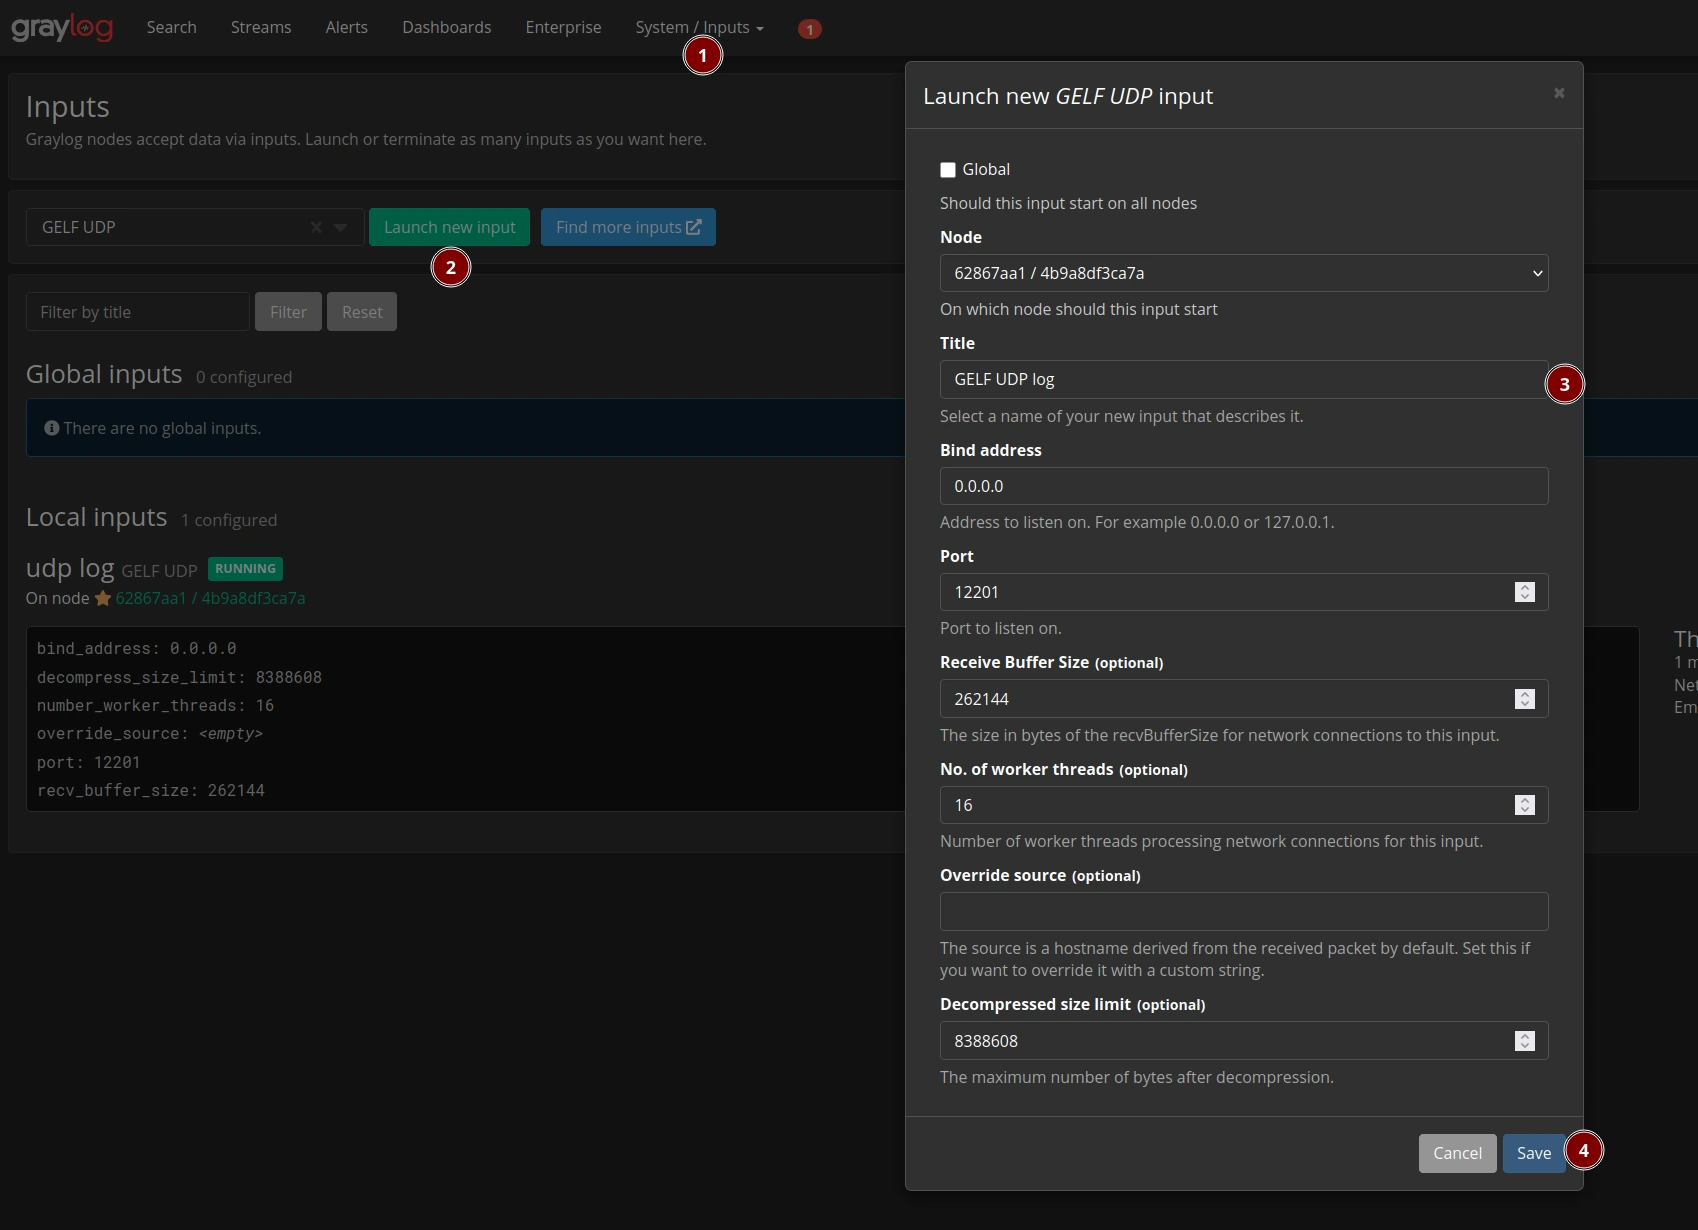
Create a GELF UDP input
- Open Graylog → System → Inputs.
- Choose GELF UDP and click Launch new input.
- Set Bind address to
0.0.0.0and Port to12201. - 保存(Save)をクリックします.
Configure XProxy for Graylog
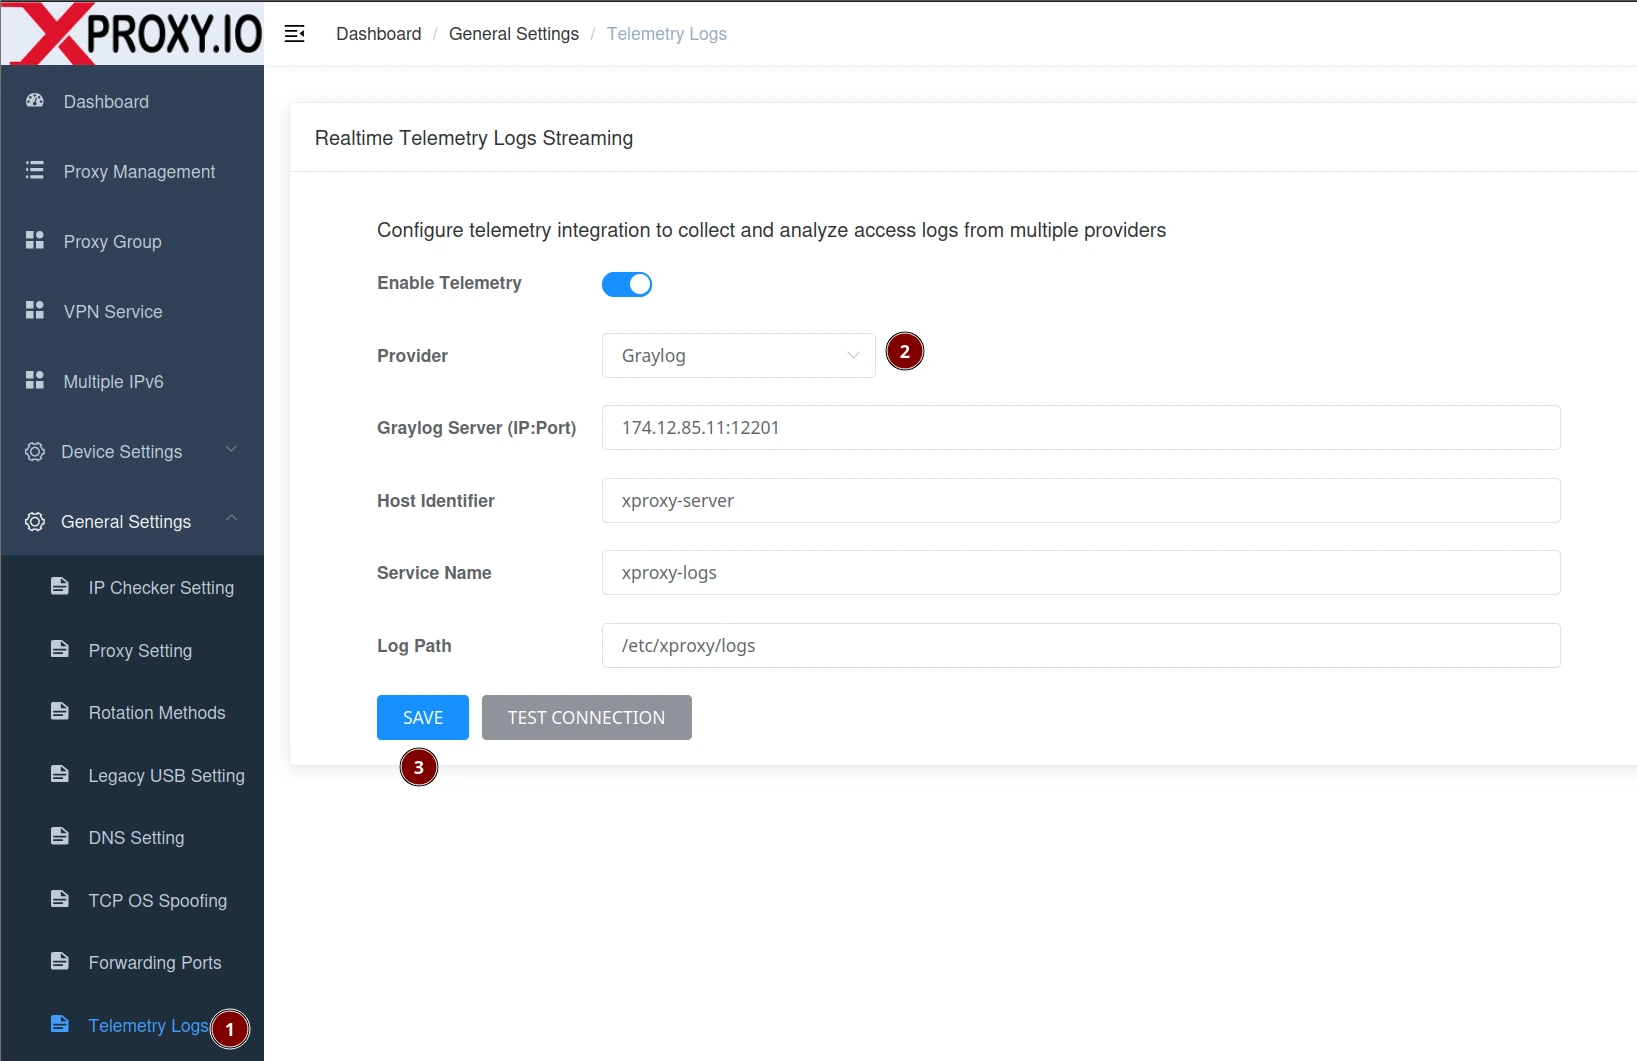
- Open General Settings → Telemetry Logs.
- Toggle Enable Telemetry ON.
- Set Provider to Graylog.
- Enter Graylog Server as
YOUR_GRAYLOG_IP:12201. - Set Host Identifier and Service Name (optional but recommended).
- Click Save, then Test Connection.
Query examples in Graylog
# By service/cluster
service_name:xproxy-region-a

# Only errors
error_code:!00000

# By action
action:CONNECT

# By device/slot
modem_position:3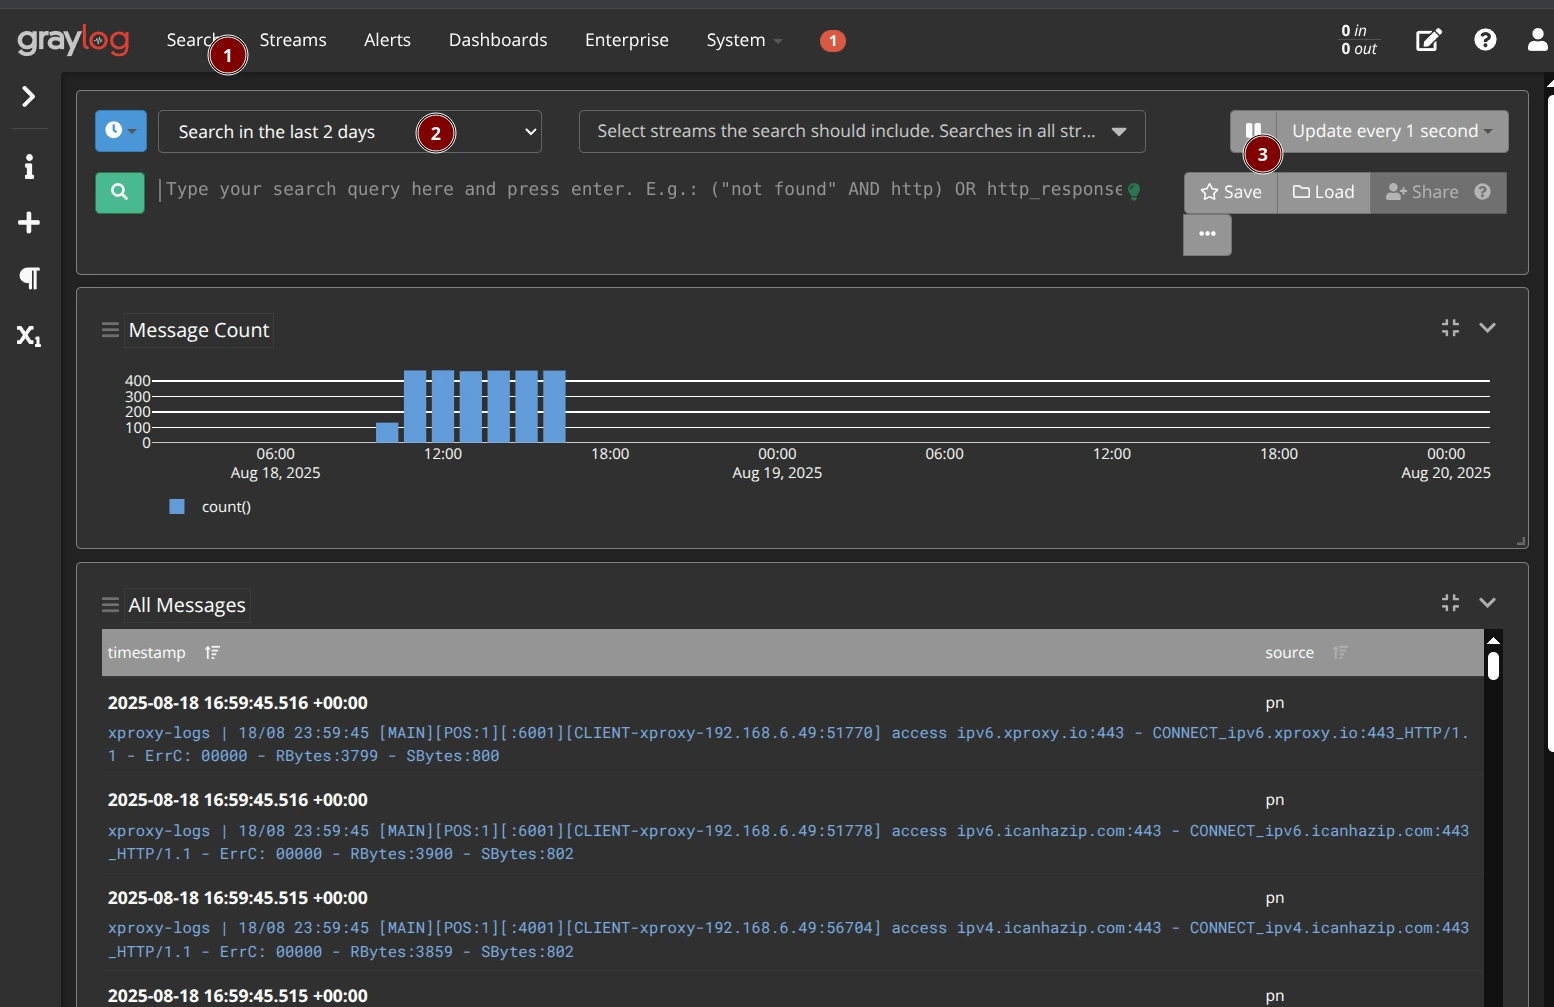
Option B — SigNoz
Install SigNoz (Community)
必要な環境・要件: Ubuntu Server 20.04, 22.04, or 24.04. Skip if using SigNoz Cloud.
curl x-proxy.io/signoz | bash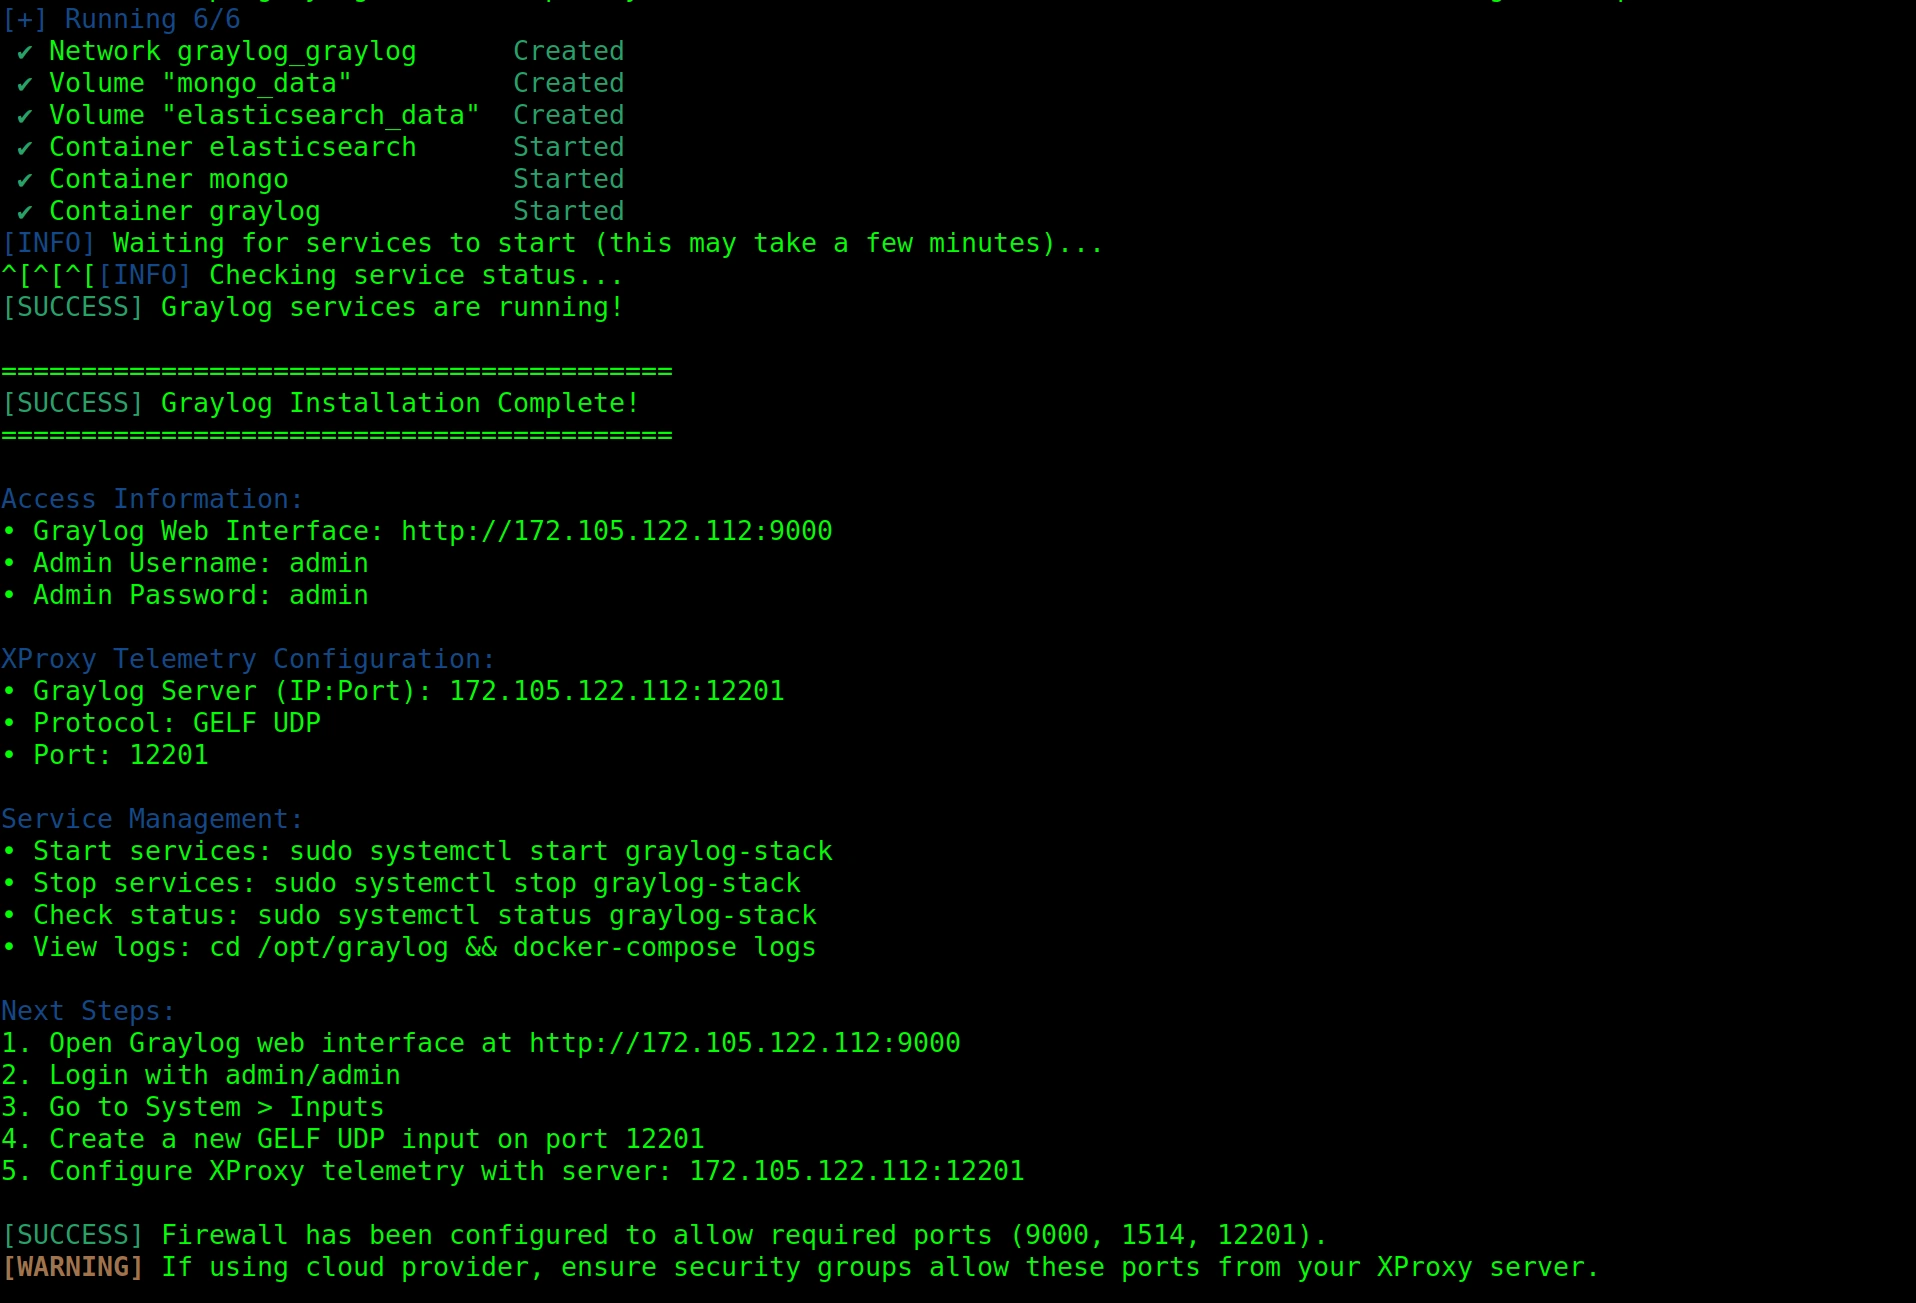
Configure XProxy for SigNoz
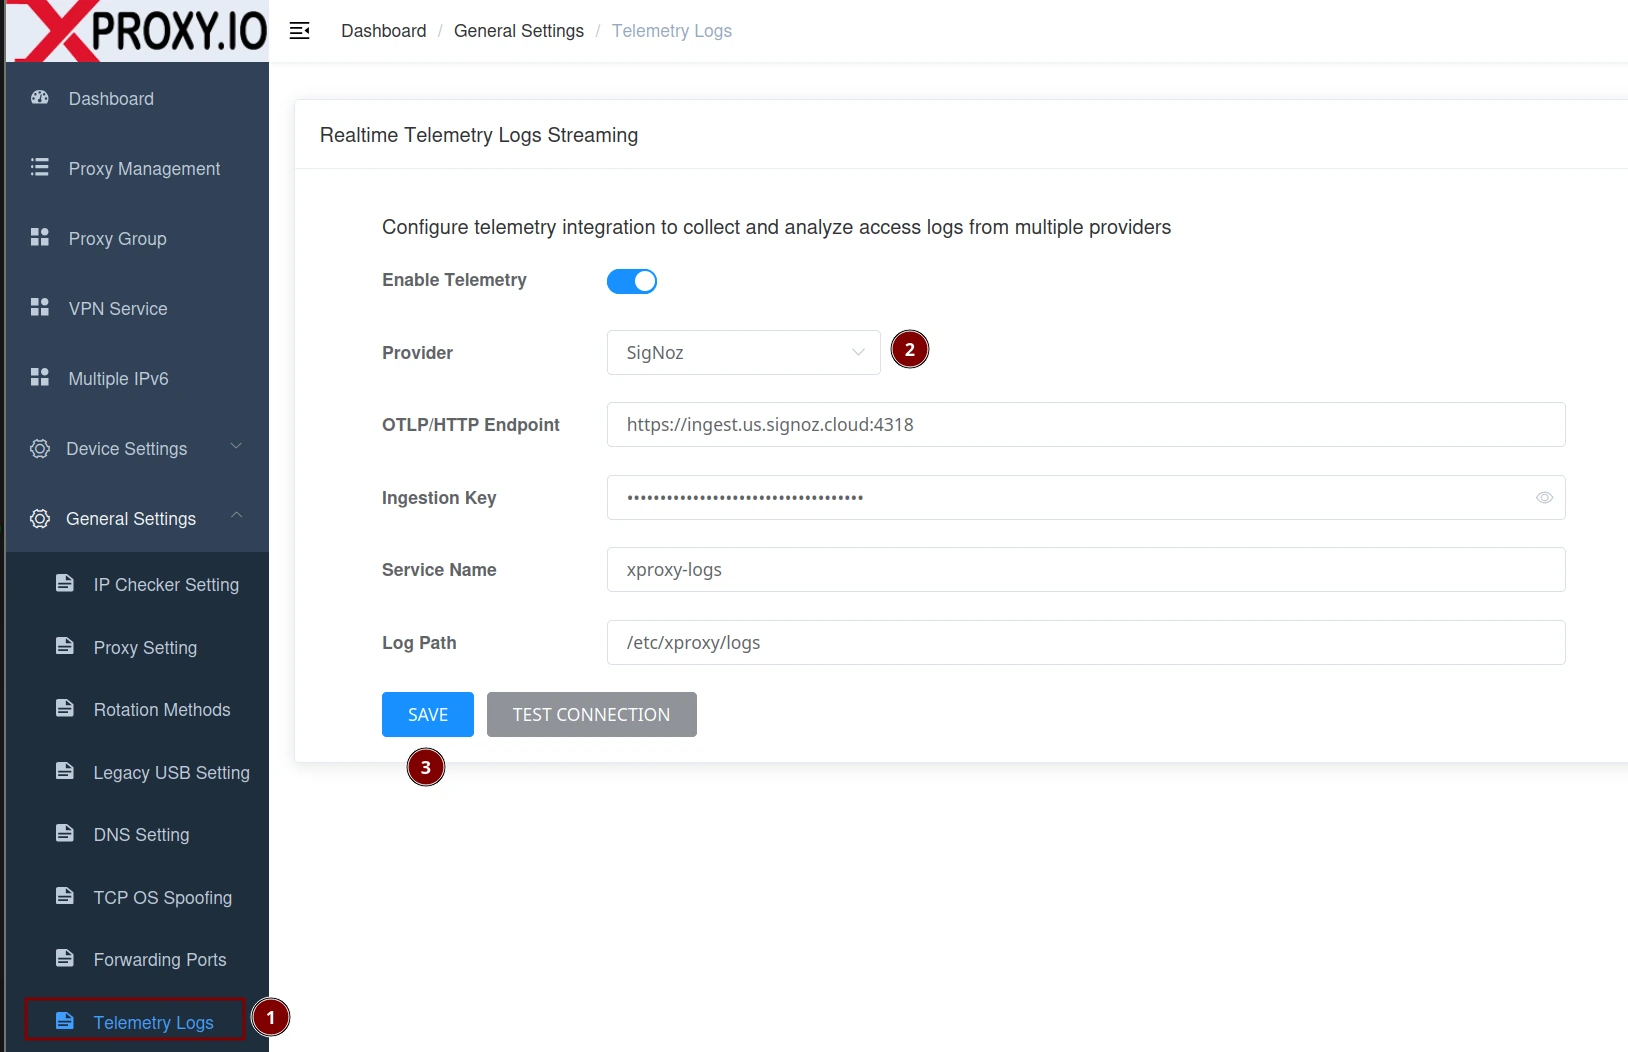
- Open General Settings → Telemetry Logs.
- Toggle Enable Telemetry ON and select SigNoz as Provider.
- Enter OTLP/HTTP Endpoint, e.g.
https://ingest.us.signoz.cloud:4318. - Paste your Ingestion Key (SigNoz Cloud) or leave blank for local installs.
- Set Service Name (e.g.
xproxy-region-a). - Click Save, then Test Connection.
Query examples in SigNoz
# By service name
service.name = "xproxy-region-a"

# Only errors
attributes.error_code != "00000"

# By action
attributes.action = "CONNECT"

# By device/slot
attributes.modem_position = 3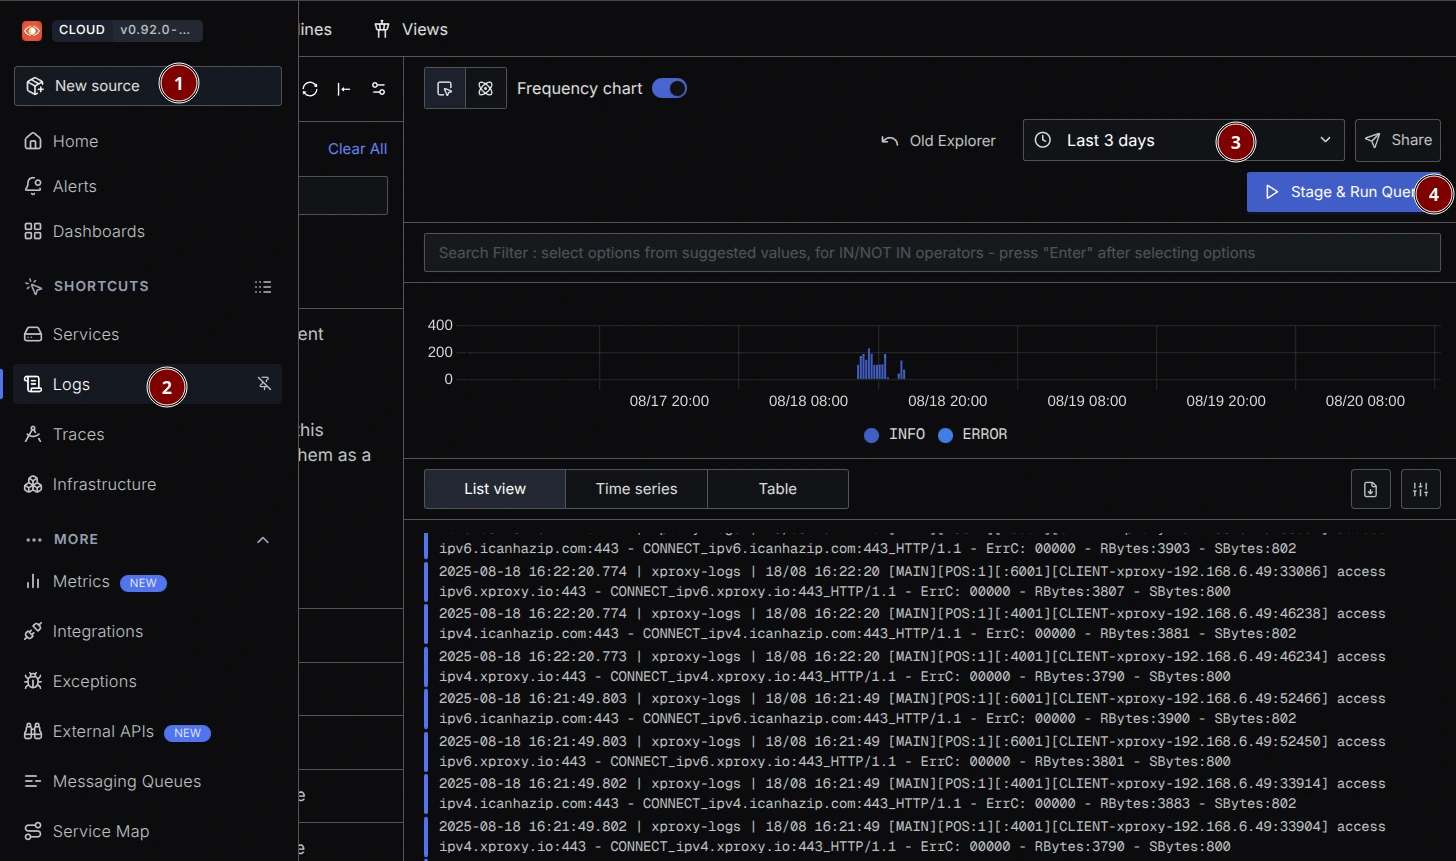
Log field reference
| Field | Description |
|---|---|
log_date | Date of the log (DD/MM) |
log_time | Time of the log (HH:MM:SS) |
proxy_service | Service group name (e.g. MAIN) |
modem_position | Device/slot index serving the request |
proxy_protocol | HTTP or SOCKS5 |
proxy_port | Proxy listening port on XProxy |
proxy_user | Username used to authenticate (empty for IP whitelist) |
client_ip | IP of the client using the proxy |
destination_host | Target host requested via proxy |
destination_port | Target port |
action | CONNECT (tunnel) or ACCESS (HTTP request) |
error_code | 00000 = success; non-zero = error |
received_bytes | Bytes from destination to client |
sent_bytes | Bytes from client to destination |
Error code reference
XProxy はログに 5 桁の error_code を出力します(例: 00000、00004)。先頭のゼロは、一貫したソートとフィルタリングのために意図的に付けられています。
00000— Success (connection closed normally)00001–00009— Authentication errors (ACL/username/password)00010— Traffic limit exceeded00011–00019— Connection errors (socket/bind/connect)00020–00029— Internal errors (e.g. memory allocation)00030–00039— HTTP CONNECT proxy redirection errors00050–00069— SOCKS5 proxy redirection errors00090–00099— Connection timeouts / network issues00100— Host not found00200–00299— UDP portmapper errors00300–00399— TCP portmapper errors00400–00499— SOCKS proxy errors00500–00599— HTTP proxy errors
トラブルシューティング
- No data — ensure telemetry is enabled and you clicked Save. Generate traffic via any proxy port.
- Graylog — confirm the GELF UDP input is running on port 12201 and firewall allows UDP 12201.
- SigNoz — endpoint must include port 4318 and be reachable via HTTPS. Verify ingestion key and workspace region.
動作確認
- Graylog —
service_name:xproxy-logsで検索し、右パネルでメッセージフィールドを確認します。 - SigNoz — Logs Explorer で、設定した正確なサービス名(例:
service.name = "xproxy-region-a")でフィルタリングします。またはフィルターをクリアしてすべてのログを表示し、取り込みを確認します。任意の行を開くと属性を確認できます。
FAQ
ログがストリーミングされているか確認するには?
上記の動作確認セクションを参照してください。Graylog では service_name:xproxy-logs で検索し、SigNoz では Logs Explorer を開いて service.name でフィルタリングします。
デバイスや地域を区別するには?
サーバーごとに Host Identifier を、地域やクラスターごとに Service Name を設定します。これらのラベルはすべてのログに表示されます。
proxy_user が空なのはなぜ?
IP ホワイトリストを使用している可能性が高く、認証ユーザー名が存在しません。
CONNECT と ACCESS の違いは?
CONNECT はトンネルの確立、ACCESS は宛先へのプロキシ経由の HTTP リクエストです。
エラーに対してアラートを出すには?
一定期間内に error_code != "00000" となるルールを作成し、service_name や modem_position でグループ化して原因を特定します。
